The JAM Linear Regression Pack is a set of TradeStation indicators that use Linear Regression in their calculations. The indicators enhance current TradeStation indicators, add new indicators that are missing from TradeStation, and add new indicators that are completely unique to JAM Strategy Trading.
The benefits of using the JAM Linear Regression Pack include:
- Several new indicators that are not provided by TradeStation. TradeStation only provides two simple Linear Regression based indicators by default. The JAM Linear Regression Pack contains ten indicators.
- Channel based indicators allow channels to be calculated with Standard Deviation (as used in Bollinger Bands), Average True Trange (as used in Keltner Channels), Highest High/Lowest Low points, a percentage of price, a fixed number of ticks or Standard Error.
- Indicators have been greatly enhanced, such as options to change colors based on direction.
- All indicators work with RadarScreen.
- Indicators and functions have an additional input that allows forecasting into the future (called ‘Target Bar’). TradeStation uses a forecast value of 0 which does not match many other trading packages, which use a forecast value of 1. This option makes it easier to move from other platforms to TradeStation.
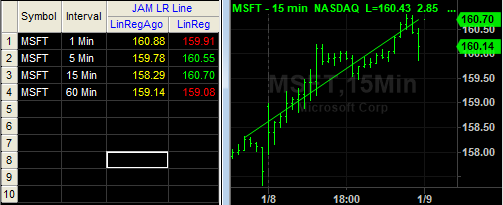
| JAM Linear Regression Line (and inputs) | |
 |
 |
This indicator is an enhanced version of the standard TradeStation ‘Linear Reg Line’ indicator. As well as being able to change the Target Bar (to match different platforms), the style of the line can be changed, it can be colored according to direction, and the current value can be displayed in the right hand margin. In RadarScreen it displays the current and ‘Length’ ago value of the linear regression line.
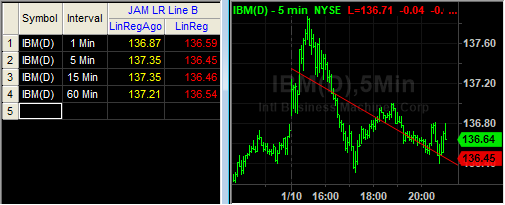
| JAM Linear Regression Line B (and inputs) | |
 |
 |
This indicator is unique to JAM Strategy Trading. It is similar to the JAM Linear Regression Line indicator (above), but instead of an end date and time, a start date and time can be specified (this is how the ThinkOrSwim and TradeDecision platforms show Linear Regression lines). But you don’t have to specify a particular date and time, you can say ‘start the linear regression line at the open of the day’ or ‘… yesterday’. The Linear Regression line will then grow through the day recalculating on each new bar. It’s showing you a dynamic length Linear Regression line which continually changes to incorporate the entire days data!
JAM Linear Regression Line with Channels
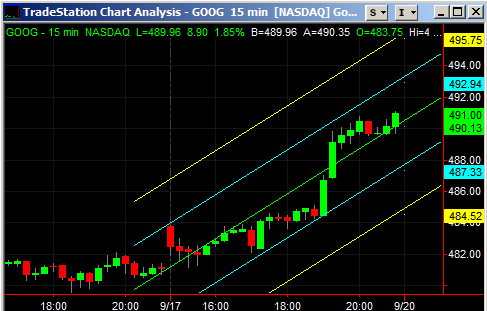
This indicator is similar to the JAM Linear Regression Line indicator, but with added channels. It has all the features of the Line indicator, plus the ability to draw upto three sets of channel lines above and below the central Linear Regression Line. The channels can be calculated with any combination of Standard Deviation, Average True Range, Standard Error, percentage of price, fixed number of ticks, high/low of Line, Raff Channels, or modified Raff Channels.
| Linear Regression Curve | Linear Regression Curve with Channels | |
 |
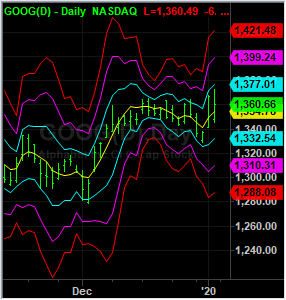 |
The JAM Linear Regression Curve indicator is an equivalent of the TradeStation Linear Reg Curve indicator, but with color inputs, and a Target Bar input to enable matching with other platforms. The calculation is also much more efficient than the TradeStation version, processing around 40% faster. The JAM Linear Regression Curve with Channels indicator has upto three channels that can be set to calculate the channel based on Standard Deviation, Average True Range, percentage of price, fixed number of ticks or Standard Error.
| Linear Regression Angle | Linear Regression Slope | |
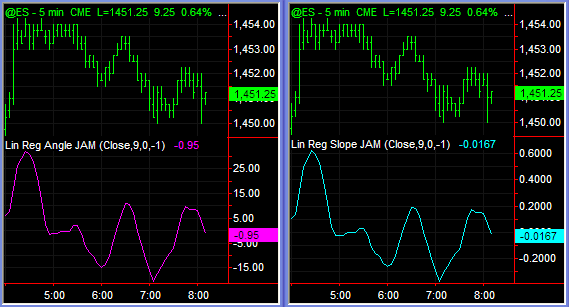
The JAM Linear Regression Angle measures the angle (Tangent of the ‘Rise over Run’ or ‘Opposite over Adjacent’, depending on your country!) of the linear regression line on each bar. It displays as an oscillator. The JAM Linear Regression Slope indicator measures the slope (‘Rise over Run’ or ‘Opposite over Adjacent’) on each bar. It displays as an oscillator. Both indicators produce similar charts, but with different values.
+
The full set of indicators included in the pack are as follows:
| JAM Indicators | TS Equivalent | |
| Indicators |
Linear Regression Line Linear Regression Line B Linear Regression Line Channels* Linear Regression Line Channels B* Linear Regression Curve Linear Regression Curve Channels** Linear Regression Intercept Linear Regression Intercept Channels** Linear Regression Angle Linear Regression Slope * Channel based on Standard Deviation, Average True Range, Highest High/Lowest Low, percentage of price, fixed number of ticks or Standard Error. **Channel based on Standard Deviation, Average True Range, percentage of price, fixed number of ticks or Standard Error. |
Linear Reg Line – – – Linear Reg Curve – – – – – |
DISCLAIMERS:
Neither TradeStation Technologies nor any of its affiliates has reviewed, certified, endorsed, approved, disapproved or recommended, and neither does or will review, certify, endorse, approve, disapprove or recommend, any trading software tool that is designed to be compatible with the TradeStation Open Platform.
NOTHING ON THIS WEB SITE IS AN OFFER OR SOLICITATION OF SECURITIES OR INVESTMENT PRODUCTS OR SERVICES IN ANY JURISDICTION WHERE THEIR OFFER OR SALE OR PERFORMANCE IS NOT QUALIFIED OR EXEMPT FROM REGISTRATION.
Futures, stocks, and spot currency trading have large potential rewards, but also large potential risk. You must be aware of the risks and be willing to accept them in order to invest in the futures, stocks, and forex markets. Don't trade with money you can't afford to lose. This website is neither a solicitation nor an offer to Buy/Sell futures, stocks or forex. No representation is being made that any account will or is likely to achieve profits or losses similar to those discussed on this website. Past performance of indicators or methodology are not necessarily indicative of future results.
CFTC RULE 4.41 - HYPOTHETICAL OR SIMULATED PERFORMANCE RESULTS HAVE CERTAIN LIMITATIONS. UNLIKE AN ACTUAL PERFORMANCE RECORD, SIMULATED RESULTS DO NOT REPRESENT ACTUAL TRADING. ALSO, SINCE THE TRADES HAVE NOT BEEN EXECUTED, THE RESULTS MAY HAVE UNDER-OR-OVER COMPENSATED FOR THE IMPACT, IF ANY, OF CERTAIN MARKET FACTORS, SUCH AS LACK OF LIQUIDITY. NO REPRESENTATION IS BEING MADE THAT ANY ACCOUNT WILL OR IS LIKELY TO ACHIEVE PROFIT OR LOSSES SIMILAR TO THOSE SHOWN.