The JAM Higher Timeframe (HT) Pack is a set of TradeStation indicators and functions that calculate and plot the values of indicators on lower bar interval Charts/RadarScreens as though they were running on higher bar interval Charts/RadarScreens. It is our most popular product, used by thousands of traders all over the world!
Risk Disclosures
(a) Risk Disclosure: Futures and forex trading contains substantial risk and is not for every investor. An investor could potentially lose all or more than the initial investment. Risk capital is money that can be lost without jeopardizing ones’ financial security or life style. Only risk capital should be used for trading and only those with sufficient risk capital should consider trading. Past performance is not necessarily indicative of future results.
(b) Hypothetical Performance Disclosure: Hypothetical performance results have many inherent limitations, some of which are described below. No representation is being made that any account will or is likely to achieve profits or losses similar to those shown; in fact, there are frequently sharp differences between hypothetical performance results and the actual results subsequently achieved by any particular trading program. One of the limitations of hypothetical performance results is that they are generally prepared with the benefit of hindsight. In addition, hypothetical trading does not involve financial risk, and no hypothetical trading record can completely account for the impact of financial risk of actual trading. for example, the ability to withstand losses or to adhere to a particular trading program in spite of trading losses are material points which can also adversely affect actual trading results. There are numerous other factors related to the markets in general or to the implementation of any specific trading program which cannot be fully accounted for in the preparation of hypothetical performance results and all which can adversely affect trading results.
The JAM HT Pack allows you to:
- Work with multiple interval ticks charts
- Work with multi-timeframe data in RadarScreen
- Use IntrabarOrderGeneration (IOG) and multi-timeframes together in your strategies
- Get higher-timeframe ‘in-between’ bars values on lower-timeframe charts
- Optimize strategies based on bar interval
- Work with charts that aren’t available in TradeStation, such as two day, two week, quarterly and yearly charts.
NEW IN VERSION 4.5
- Many more indicators and functions. Now over 40 indicators and 45 functions.
- Indicators have been improved to include alerts and coloring, where necessary.
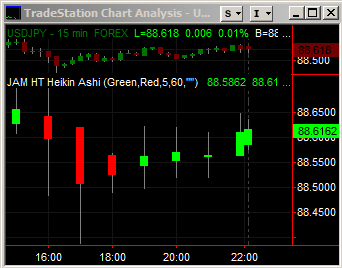
- Includes four price indicators – Candlesticks, OHLC bars, Overlay bars, Heikin Ashi bars.
- Heikin Ashi (HA) bars. HA price bars can be displayed, and all HT indicators can be applied to HA bars.
- Indicators now support ‘gapless’ calculations.
- New Indicator documentation, and new Function documentation to help you build your own HT indicators and strategies.
No slow and complicated DLLs. No multi-datastream charts to mess up the charts formatting. No approximations. All the JAM HT Pack indicators are simple, single indicators that do internal calculations to provide the EXACT higher timeframe indicator values.
Whether you’re using Charting or RadarScreen, backtesting or trading live, tick, minute or daily+ bar intervals, the JAM HT Pack indicators always calculate the exact higher timeframe values.
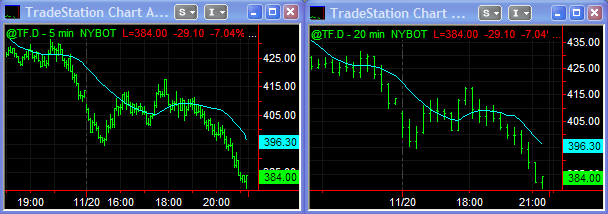
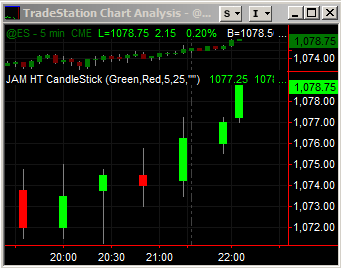
You can see on this 5 minute chart on the left the JAM HT Avg Simple indicator is accurately calculating a 20 minute SMA as shown on the chart on the right. This value is 100% accurate from the beginning of the chart to the end.
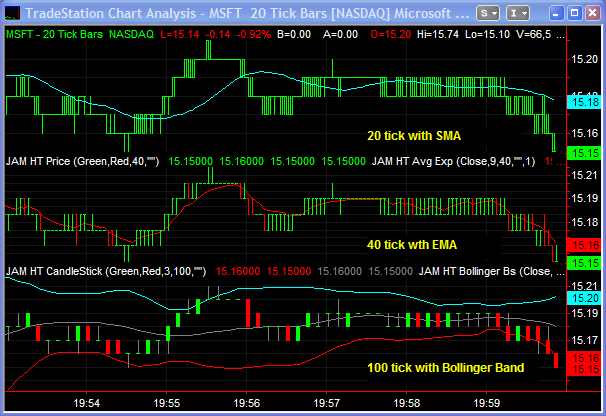
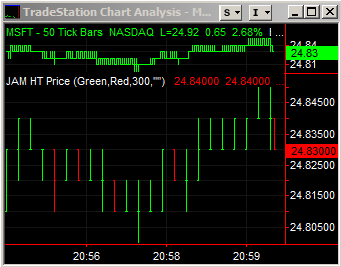
This chart shows three tick timeframes on one chart! The first is a 20 tick with a Simple Moving Average applied, the second a 40 tick with an Exponential Moving Average, and the third a 100 tick with Bollinger Bands. This is all done on a single chart.
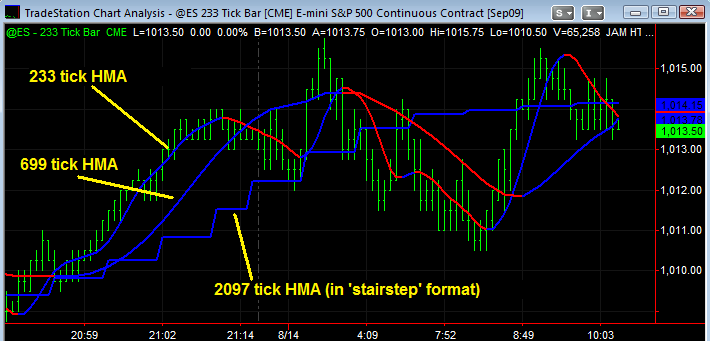
An alternative way to display indicators is to have multiple HT indicators on a single chart. This 233 tick chart is showing a 233 tick Hull Moving Average (HMA), a 699 tick HMA, and a 2097 tick HMA all in the same window. Note that the 2097 tick HMA is in ‘stairstep’ format. This is one of three display types for your indicators.
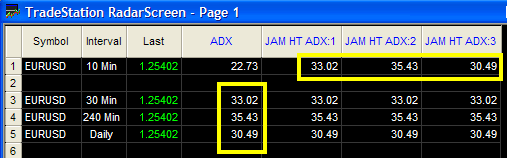
This RadarScreen shows ADX for multiple timeframes on one line. The first line shows JAM HT ADX for 30 minutes, 4 hours and 1 day. You can see on the three lines below that the values match exactly the TradeStation ADX indicator applied on the matching timeframe.
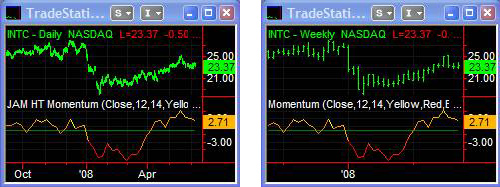
The chart on the left is diplaying Weekly Momentum on a Daily chart. Note that even the gradient coloring exactly matches the higher timeframe chart!
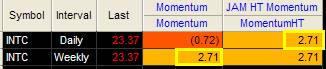
Then this RadarScreen is showing exactly the same information as above. All HT indicators work with both Charting and RadarScreen.
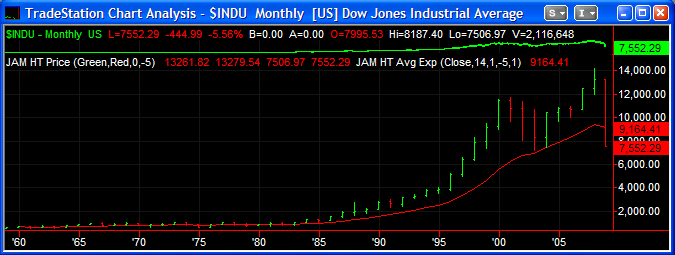
This is a Yearly chart of the $INDU. Not only can the JAM HT Pack display yearly charts (which aren’t available in TradeStation), but we can also apply indicators to them.
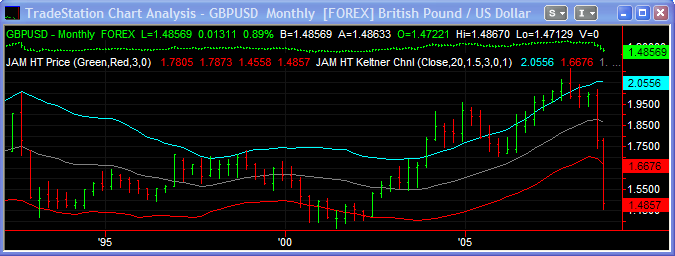
A Quarterly chart of GBPUSD. Again, the JAM HT Pack is displaying charts that aren’t available in TradeStation, with indicators applied!
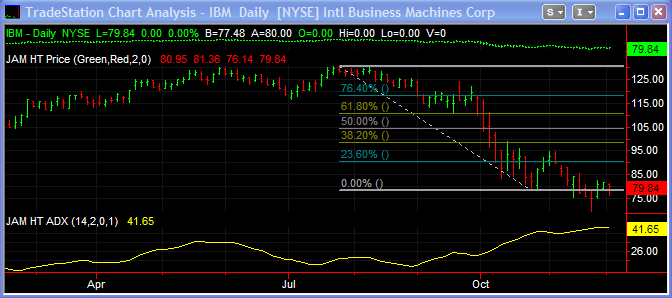
Finally, we have a two day chart of IBM. It has the both ADX indicator applied and the standard ‘Fibonacci Price Retracement Lines’ taken from the TradeStation Drawing Objects menu.
The HT Pack has four price indicators – Candlesticks, OHLC bars, overlay bars and Heikin Ashi bars
The following indicators are currently available:
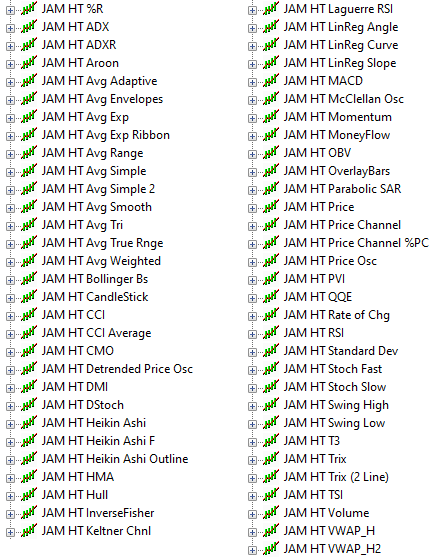
New indicators are always in development. If there are any standard indicators you would like to see added to this list then please contact me .
If you have your own indicators or functions that you would like converted to work with Higher Timeframes then please contact me for a quote.
The following HT equivalent functions are also available:
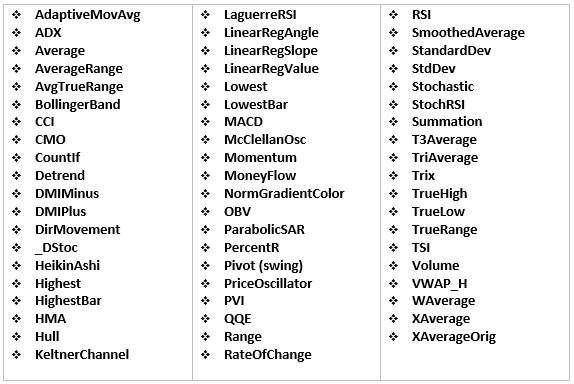
EasyLanguage programmers can use these functions to create there own higher timeframe indicators and strategies.
HT indicators work as a direct multiple of the current chart’s bar interval . i.e. if you are on a 5 minute chart then you can calculate the higher timeframe indicator for a 10, 15, 20, 25 minute etc chart. But you can’t calculate for a 7, 11, 13 minute etc chart.
The following table shows the accuracy of results when converting from one timeframe to another:
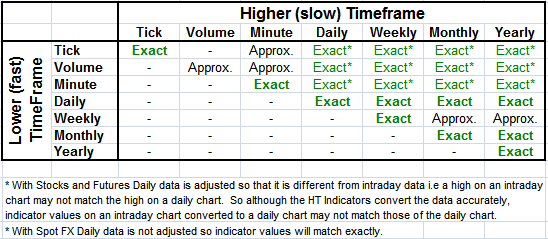
If you want to check if HT indicators work for you then download and try the free HT Simple Moving Average indicator from here (documentation here). Or Contact Me if you have any questions.
Indicators can be purchased individually or as part of the whole pack. You will also receive documentation on how to use the HT functions so that you can incorporate them into your own indicators and strategies. All functions are encrypted – you do not have access to the function code. Everything is licensed to your TradeStation Customer Number .
* When you purchase any HT indicator you will also receive an updated copy of the Higher Timeframe Simple Moving Average indicator that is more configurable and enables you to use price inputs other than ‘Close’.
You will appreciate that once you have the package you have all the code, so there are no refunds. If you wish to test out the JAM HT Indicators then a free download is available here (documentation here). I’m also happy to send you the latest documentation for the full indicator pack.
If you need more information then please feel free to contact me .
DISCLAIMERS:
Neither TradeStation Technologies nor any of its affiliates has reviewed, certified, endorsed, approved, disapproved or recommended, and neither does or will review, certify, endorse, approve, disapprove or recommend, any trading software tool that is designed to be compatible with the TradeStation Open Platform.
NOTHING ON THIS WEB SITE IS AN OFFER OR SOLICITATION OF SECURITIES OR INVESTMENT PRODUCTS OR SERVICES IN ANY JURISDICTION WHERE THEIR OFFER OR SALE OR PERFORMANCE IS NOT QUALIFIED OR EXEMPT FROM REGISTRATION.
Futures, stocks, and spot currency trading have large potential rewards, but also large potential risk. You must be aware of the risks and be willing to accept them in order to invest in the futures, stocks, and forex markets. Don't trade with money you can't afford to lose. This website is neither a solicitation nor an offer to Buy/Sell futures, stocks or forex. No representation is being made that any account will or is likely to achieve profits or losses similar to those discussed on this website. Past performance of indicators or methodology are not necessarily indicative of future results.
CFTC RULE 4.41 - HYPOTHETICAL OR SIMULATED PERFORMANCE RESULTS HAVE CERTAIN LIMITATIONS. UNLIKE AN ACTUAL PERFORMANCE RECORD, SIMULATED RESULTS DO NOT REPRESENT ACTUAL TRADING. ALSO, SINCE THE TRADES HAVE NOT BEEN EXECUTED, THE RESULTS MAY HAVE UNDER-OR-OVER COMPENSATED FOR THE IMPACT, IF ANY, OF CERTAIN MARKET FACTORS, SUCH AS LACK OF LIQUIDITY. NO REPRESENTATION IS BEING MADE THAT ANY ACCOUNT WILL OR IS LIKELY TO ACHIEVE PROFIT OR LOSSES SIMILAR TO THOSE SHOWN.